Picture this: You're a production manager staring at another shipment delay notification while your phone buzzes with frustrated customer calls. Your team is working harder than ever, but somehow you're still missing deadlines and burning through your budget with overtime costs. Sound familiar?
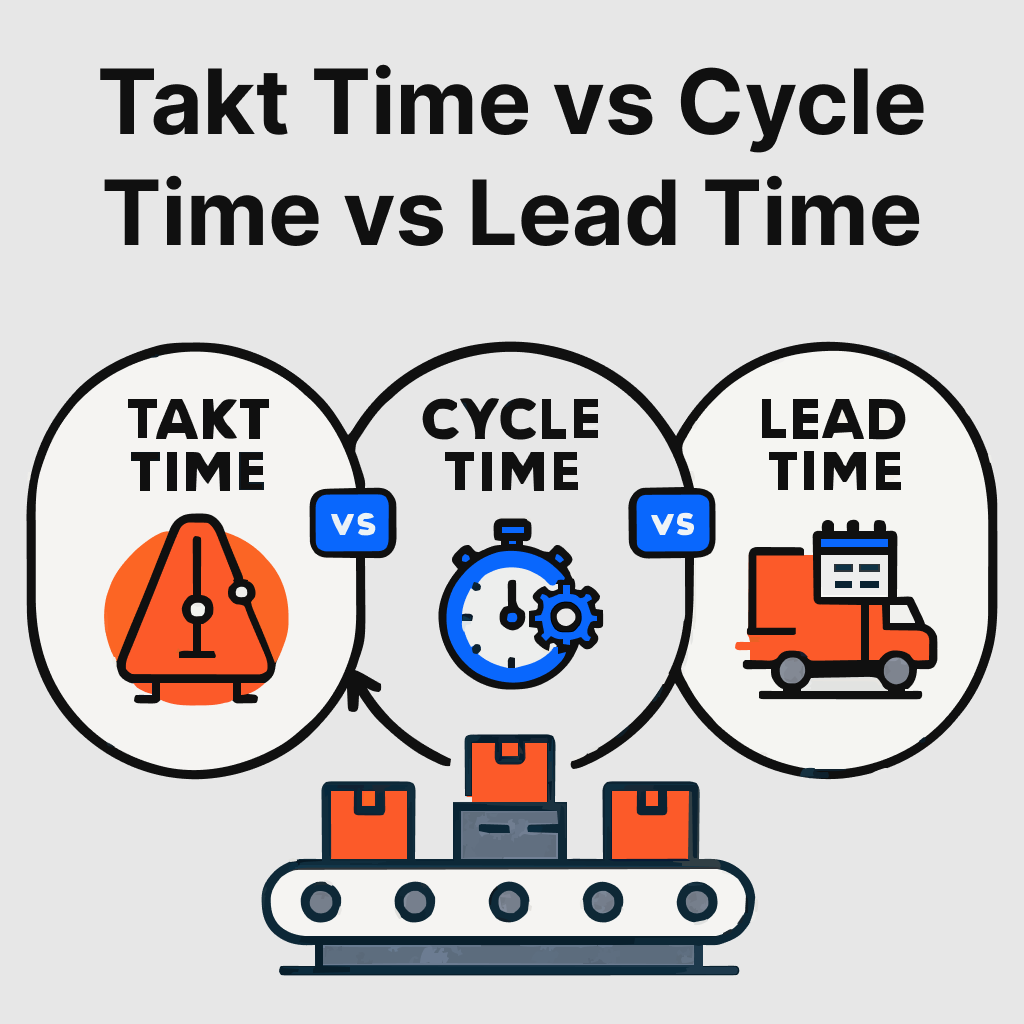
The good news is that focusing on three simple metrics can transform this chaos into smooth, predictable operations that delight your customers and boost your profitability. These three metrics are Takt time, cycle time and lead time.
Understanding these powerful metrics will unlock your ability to identify bottlenecks, eliminate waste, and create a production flow that perfectly matches customer demand. Whether you're implementing lean manufacturing principles or optimizing your kanban system, mastering these concepts is your gateway to building a more efficient, profitable operation.
Let's dive into what these critical metrics are and how they can revolutionize your manufacturing operations.
At-a-Glance: Takt vs. Cycle vs. Lead Time
Understanding takt time vs cycle time vs lead time becomes clearer when you see them side by side:
Of course, here is the HTML code for the table in the image. You can embed this directly into a web page.
code
Html
download
content_copy
expand_less
| Metric |
What It Measures |
Perspective |
Purpose |
| Takt Time |
Required pace to meet demand |
Demand-focused (External) |
Synchronize production with sales |
| Cycle Time |
Actual speed of a process |
Process-focused (Internal) |
Measure and improve process efficiency |
| Lead Time |
Total time from order to delivery |
Customer-focused (External) |
Measure total customer experience |
Each metric provides unique insights that complement the others, creating a complete picture of your manufacturing performance.
What is Takt Time? The Heartbeat of Customer Demand
Think of takt time as your production's heartbeat - the steady rhythm that keeps everything in perfect sync with what your customers actually need. The word "takt" comes from the German word for "beat" or "pulse," and that's exactly what it represents: the consistent pace your production must maintain to satisfy customer demand.
Here's what makes takt time so powerful: it measures demand, not your production capacity. This isn't about how fast your machines can run or how quickly your team can work. Instead, takt time dictates the required production rhythm based on what your customers are ordering.
Why Takt Time is Your Secret Weapon
When you align your production with takt time, incredible things happen:
- Eliminate overproduction waste by producing exactly what customers need, when they need it
- Prevent stockouts and delays by ensuring your production pace matches demand
- Design balanced production lines where every workstation contributes to the overall rhythm
- Give your team a clear, achievable target that drives consistent performance
Manufacturing research from McKinsey shows that optimizing takt time alignment can boost line productivity by 20% and cut production time by 25%.
How to Calculate Takt Time
The takt time formula is beautifully simple yet incredibly effective:
Takt Time = Net Available Production Time ÷ Customer Demand
Let's see this in action: Your factory operates 8 hours daily (480 minutes). After subtracting 60 minutes for breaks, meetings, and changeovers, you have 420 minutes of net available production time. If customer demand is 200 units per day, your takt time becomes:
420 minutes ÷ 200 units = 2.1 minutes per unit
This means you need to complete one unit every 2.1 minutes to perfectly match customer demand. It's like having a metronome setting the beat for your production orchestra - everyone works in harmony to deliver exactly what customers expect.
What is Cycle Time? Your Production Speed Reality Check
While takt time sets your target pace, cycle time reveals your actual production speed. This metric measures the real time it takes to complete one unit from start to finish, giving you an honest assessment of your current performance.
Cycle time captures everything that happens during production: the value-added work, the waiting between operations, the small delays, and even the brief equipment hiccups. It's your production reality, unfiltered and unvarnished.
Why Cycle Time Drives Continuous Improvement
Understanding your cycle time opens up incredible opportunities for growth:
- Pinpoint exact bottlenecks by identifying which processes take longest
- Measures efficiency gains as you implement process improvements
- Assess individual and team efficiency with concrete data
- Build realistic production schedules based on actual capabilities
Research from manufacturing KPI analysis demonstrates that reducing cycle time directly improves equipment efficiency, on-time delivery rates, and overall manufacturing capacity.
How to Calculate Cycle Time
The cycle time formula gives you immediate insight into your production performance:
Cycle Time = Net Production Time ÷ Number of Units Produced
Using our earlier example: In 420 minutes of net production time, your team produces 180 units. Your cycle time becomes:
420 minutes ÷ 180 units = 2.33 minutes per unit
Think of cycle time like timing a baker making bread from mixing the dough to pulling the finished loaf from the oven. Every step, every pause, every moment contributes to the total time - and that's valuable information for improvement.
What is Lead Time? Your Customer's Complete Journey
Lead time is the total customer experience - the complete time from when they place an order to when they receive their finished product. This metric matters immensely because it's what your customers actually see and feel.
Lead time encompasses everything in your value stream: order processing, material procurement, production, quality control, packaging, shipping, and delivery. It's the ultimate measure of your responsiveness to customer needs.
%201.svg)


.svg)


.svg)
.svg)

.svg)