
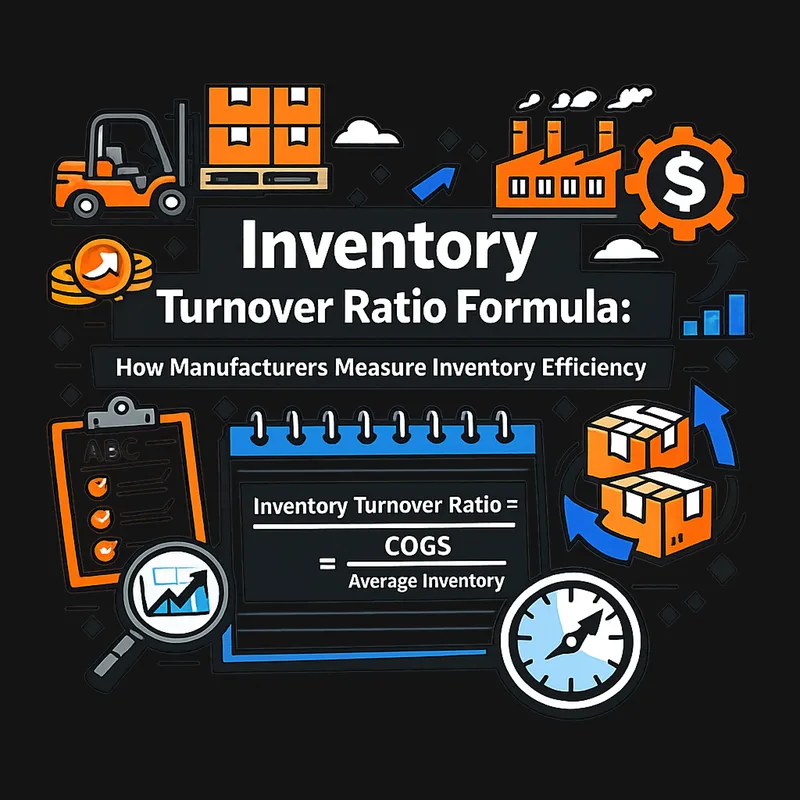
Inventory Turnover Ratio Formula: How Manufacturers Measure Inventory Efficiency
Learn the inventory turnover ratio formula, how to calculate it with a real manufacturing example, and what a good ratio looks like for your shop floor.
Most shops calculate inventory turnover once a year, glance at the number, and move on. That is a waste. Turnover is the one metric that tells you whether cash is moving through your floor or quietly dying on a rack, and if you read it right, it tells you exactly which parts are the problem. The inventory turnover ratio measures how efficiently your shop floor converts raw material and bought-in parts into shipped product, and whether stock is piling up and eating working capital.
Key Takeaways
- Inventory Turnover Ratio = Cost of Goods Sold / Average Inventory. Days Inventory Outstanding = 365 / ITR.
- Most general manufacturers land between 4 and 8 turns per year, averaging around 5.3. Fast-moving discrete manufacturers can run 8–15. Small shops with wide part variety sometimes run as low as 2–3. A ratio below 3 can signal excess stock or slow demand depending on your industry.
- A ratio that is too high can be just as dangerous as one that is too low. It may mean you are cutting safety stock too thin and setting up for stockouts.
- Pull systems like two-bin kanban raise turnover naturally by capping on-hand stock at roughly two bins' worth instead of topping up to a high watermark.
- Measure ITR at the item or category level, not just company-wide. A blended number can hide slow-moving SKUs buried under fast-moving ones.
What Is the Inventory Turnover Ratio?
The inventory turnover ratio measures how many times a company sells through and replaces its inventory during a set period, usually a year. A ratio of 6 means your average unit of stock was consumed and restocked six times over twelve months.
The formula has two inputs: cost of goods sold (COGS) and average inventory value. COGS is the direct cost of everything you made and sold, not your revenue. Average inventory is the midpoint between your opening and closing stock value for the period.
Most manufacturers pair the ratio with its inverse, Days Inventory Outstanding (DIO), which converts the abstract multiplier into a number of days. DIO = 365 / ITR. A ratio of 5 means roughly 73 days of inventory on hand. That is the number that makes your accountant and your plant manager speak the same language.
What Is the Inventory Turnover Formula?
The inventory turnover formula is: ITR = COGS / Average Inventory.
Where:
- COGS = total cost of goods sold for the period (raw materials + direct labor + manufacturing overhead consumed in production)
- Average Inventory = (Opening Inventory Value + Closing Inventory Value) / 2
The companion formula, Days Inventory Outstanding, converts turns into days:
DIO = 365 / ITR
| Metric | Formula | What it tells you |
|---|---|---|
| Inventory Turnover Ratio | COGS / Average Inventory | How many times stock cycled in the period |
| Days Inventory Outstanding | 365 / ITR | Average days of inventory sitting on the shelf |
Some finance teams use net sales instead of COGS. COGS is the more accurate input for manufacturers because it strips out gross margin and compares inventory cost to inventory cost. Using revenue inflates the ratio.
How Do You Calculate Inventory Turnover? (Step by Step)
To calculate inventory turnover, divide your annual COGS by your average inventory value for the same period.
Here is a worked example using a real scenario.
Example: Midland Fasteners, a 45-person fastener manufacturer
Midland produces M6, M8, and M10 hex bolts for the automotive supply chain. They want to measure turnover for their 2025 fiscal year.
Step 1: Pull COGS. Annual COGS for 2025: $3,200,000 (This covers steel rod, cutting and threading costs, heat treatment, plating, and packaging consumed in finished bolt production.)
Step 2: Calculate average inventory.
- Inventory value on 1 Jan 2025: $520,000
- Inventory value on 31 Dec 2025: $480,000
- Average inventory: ($520,000 + $480,000) / 2 = $500,000
Step 3: Divide. ITR = $3,200,000 / $500,000 = 6.4 turns
Step 4: Convert to DIO. DIO = 365 / 6.4 = 57 days
Midland turns its inventory 6.4 times per year, meaning the average unit of stock sits on the shelf for about 57 days before it ships as product.
For a fastener manufacturer supplying JIT automotive customers, 6.4 turns is healthy. If the same calculation showed 3.1 turns and 118 days on hand, that would be a sign that Midland is holding material well ahead of when production actually needs it, and it would be worth checking how reorder points in a kanban system are pulling average inventory levels up.
Turnover tells you how much stock you are carrying. Cards are how you bring it down one part at a time — you can make your first kanban cards free and start with the slowest-turning items on the list.
What Is a Good Turnover Ratio?
A good inventory turnover ratio for general manufacturing is roughly 4 to 8 turns per year, with most shops averaging around 5.3.
But the right number depends on your product, your production model, and your supply chain. The table below gives a working reference by manufacturing type.
| Manufacturing type | Typical ITR range | Notes |
|---|---|---|
| General discrete manufacturing | 4–8x | Broad baseline, ~5.3x average |
| Automotive supply chain | 8–15x | JIT customer requirements drive higher turns |
| Job shop / custom fabrication | 2–5x | Wide variety, some slow-moving raw stock |
| Process manufacturing (chemicals, paints) | 3–8x | Depends on batch sizes and shelf life |
| Welding and abrasives distribution | 6–10x | Fast-moving consumables, short shelf life |
These are directional ranges, not hard targets. A job shop running 4 turns is not automatically underperforming. A fastener producer running 15 turns should double-check that its M6 bolts are not running out mid-shift.
The better question is: how does your ITR compare to the same period last year, and is it moving in the right direction?
What Does a Low Ratio Signal?
A low inventory turnover ratio, roughly below 3 for most manufacturers, signals that stock is accumulating faster than it is being consumed. Cash is frozen on the shelf in the form of raw materials, WIP, or finished goods that are not moving.
Common causes on the shop floor include over-ordering from suppliers to hit minimum order quantities, poor demand forecasting that front-loads purchases, and dead stock that has not been written off or cleared. Abrasives and welding wire that age out, CNC tooling bought for a job that was cancelled, and fasteners ordered in bulk to beat a price increase all show up here as low-turnover dead weight. The same excess inventory that drags your ratio down also crowds out the parts you actually need, which is how overstock on one line quietly turns into stockouts on another.
Low turns also inflate carrying costs. Industry guidance pegs annual carrying costs at 20–30% of average inventory value. At $500,000 in average inventory, that is $100,000 to $150,000 per year in holding costs before you have shipped a single part.
What Does a High Ratio Signal?
A high inventory turnover ratio means stock moves quickly through the facility and little cash is tied up waiting to be consumed. That sounds like a win, and usually it is, but not always.
When ITR climbs sharply, it is worth checking whether safety stock has been cut too thin. A ratio of 20 at a CNC job shop might mean the shop is running lean and efficient. It might also mean the shop is one delayed shipment away from a line stoppage because there is no buffer for lead time variability, which is exactly what correctly sized safety stock in a kanban system is meant to protect against.
High turnover in fast-moving consumables, think grinding discs, welding wire, or abrasive pads, is expected and desirable. High turnover in long-lead-time raw material that takes eight weeks to source is a risk profile, not a performance metric.
How Do You Improve Inventory Turnover?
You improve inventory turnover ratio by reducing the average inventory held for a given level of output, which means tightening the connection between what you order and what production actually needs. Six levers work reliably on the factory floor.
- Tighten reorder points. Most factories carry more buffer than their demand variability actually requires. Recalculate reorder points from current demand data, not from the estimate someone set up three years ago.
- Reduce minimum order quantities. Negotiating smaller, more frequent orders with suppliers reduces the inventory spike that follows every purchase order. The unit cost may rise slightly. The carrying cost reduction usually more than offsets it.
- Clear dead stock. Identify SKUs that have had zero consumption for 90 or 180 days and make a decision. Return, liquidate, or write off. Dead stock depresses ITR and occupies bin space that active parts need.
- Improve demand forecasting. Match purchase timing to production schedules, not to calendar habits. A monthly bulk buy for a shop running daily production cycles is usually the wrong cadence.
- Shorten supplier lead times. Longer supplier lead times force higher safety stock, which inflates average inventory and suppresses ITR. Qualifying a second supplier or negotiating a VMI arrangement can compress lead times without increasing risk.
- Implement a pull system. Pull systems like two-bin kanban cap on-hand stock at roughly two bins' worth instead of topping up to a high watermark. Bins hold only what the system needs to bridge one replenishment cycle, so on-hand stock never drifts far above what production is actually pulling.
How Do Pull Systems Improve Turnover?
Pull systems improve inventory turnover by structuring on-hand stock as a capped buffer, not as a forecast-driven accumulation. Each bin holds a fixed quantity that covers one replenishment cycle plus a small safety cushion. When the bin empties, the signal fires. Nothing more arrives until it does.
Here is the part most turnover guides skip: a pull system only lifts your ratio if the people at the bin actually use it. A min/max table buried in an ERP that nobody opens does nothing for your turns. An empty bin, or a card someone scans on the way past, does. That is the whole reason forecast-driven topping-up keeps losing to consumption-driven pull on the shop floor: pull only works when it is simple enough that the team runs it without being told to.
That is the model Arda is built on. Physical cards sit in the bins on your floor, and when a bin runs down to its replenishment point, someone scans the card and the reorder is triggered. No counts, no monthly spreadsheet, no buyer topping up to a high watermark out of habit. You never count your consumables again, and because average inventory stops drifting up between orders, your turns climb on their own. If you want to see what that looks like on a real floor, book a demo.
In a two-bin kanban setup running M8 fasteners, you size each bin to hold roughly 10 days of production demand. One bin feeds the line. When the first bin empties, the shop switches to the second bin, and the empty bin triggers a replenishment order. Average inventory hovers near the half-full point of one bin plus the second bin, which is much lower than a traditional min/max system where buyers top up to a high watermark every month.
That structural cap on average inventory is what drives the ITR improvement. COGS does not change. Average inventory drops. The ratio rises.
How Does Inventory Turnover Affect Cash Flow?
Inventory turnover affects cash flow because inventory is cash converted into stock. Every day a unit sits on the shelf before becoming a shipped product is a day that cash is not available for payroll, supplier payments, or capital investment.
A manufacturer moving from 4 turns to 6 turns, while holding COGS constant at $3,000,000 per year, reduces average inventory from $750,000 to $500,000. That frees $250,000 in working capital without changing the production volume at all.
For a 30-person shop running on tight credit terms, $250,000 in freed working capital is not a finance theory. It is the difference between taking a new customer order and declining it because there is not enough cash to buy the raw material.
FAQ
What is the inventory turnover ratio formula? Inventory Turnover Ratio = Cost of Goods Sold / Average Inventory. Average inventory is calculated as (opening inventory + closing inventory) / 2. Use COGS, not revenue, for an accurate result.
What is a good inventory turnover ratio for manufacturers? General manufacturing typically runs 4 to 8 turns per year, averaging around 5.3. Automotive supply chain manufacturers in JIT environments often see 8 to 15 turns. Job shops and custom fabricators may run 2 to 5 turns depending on raw material variety and lead times.
What does a low inventory turnover ratio mean? A low ratio means inventory is accumulating faster than it is being consumed. Stock is sitting on shelves longer than it needs to. Common causes are over-ordering, poor demand forecasting, and dead stock that has not been cleared.
Can an inventory turnover ratio be too high? Yes. A ratio that climbs too sharply can signal that safety stock has been cut too thin. If lead times are long or demand is variable, very high turns can leave the shop floor exposed to stockouts during normal supply disruptions.
What is Days Inventory Outstanding and how is it related to ITR? Days Inventory Outstanding (DIO) converts the turnover ratio into days. DIO = 365 / ITR. If your ITR is 6, your DIO is approximately 61 days, meaning the average unit of stock sits on hand for 61 days before being consumed in production and shipped.
How often should you measure inventory turnover? Measure at minimum quarterly, and track month-over-month for fast-moving product lines. Annual-only measurement hides seasonal spikes and misses the early signal on accumulating slow-movers. Track at item or category level, not just as a company-wide blended figure.
How do you improve a low inventory turnover ratio? The most direct levers are tightening reorder points, reducing order quantities to match actual demand cadence, clearing dead stock, and implementing a pull-based replenishment system. Improving supplier lead times also reduces the safety buffer you need to hold.
How does inventory turnover ratio relate to cash flow? Higher turnover means cash cycles faster. Each turn converts raw material or WIP into shipped product and then into a receivable. Reducing average inventory releases working capital that was frozen in stock, which becomes available for operations, supplier payments, or new orders.
Make the first replenishment loop visible.
Generate free Kanban cards for the parts that most often stop production.
Make Free Kanban CardsRelated reading

OEE for Manufacturers: How to Calculate and Improve Overall Equipment Effectiveness
Learn how to calculate OEE in manufacturing with the exact formula, a worked example, Six Big Losses breakdown, and practical steps to improve your score.
Jul 13, 2026Read article
Buffer Stock vs. Safety Stock: Understanding the Key Differences
Buffer stock manages internal flow variations while safety stock guards against supply disruptions. Learn the formulas, when to use each, and how they work in Kanban systems.
Mar 20, 2026Read article
Takt Time vs. Cycle Time vs. Lead Time: A Manufacturer's Guide
Learn how takt time, cycle time, and lead time work together to eliminate bottlenecks and boost throughput. Formulas, examples, and improvement strategies inside.
Mar 20, 2026Read article