
How to Calculate the Number of Kanban Cards: Formula, Steps & Examples
What is the kanban card formula and how does it impact your processes? Here's what each variable means, how to choose your inputs, and a worked example from start to finish.
The number of kanban cards your system needs is a calculation, not a guess.
Most kanban explainers hand you the formula and walk away. The formula is the easy part. Where shops actually go wrong is the inputs, and whether anyone ever revisits the card count once the spreadsheet is closed. Get the inputs right, round up the result, and the card count follows directly from how the floor actually runs.
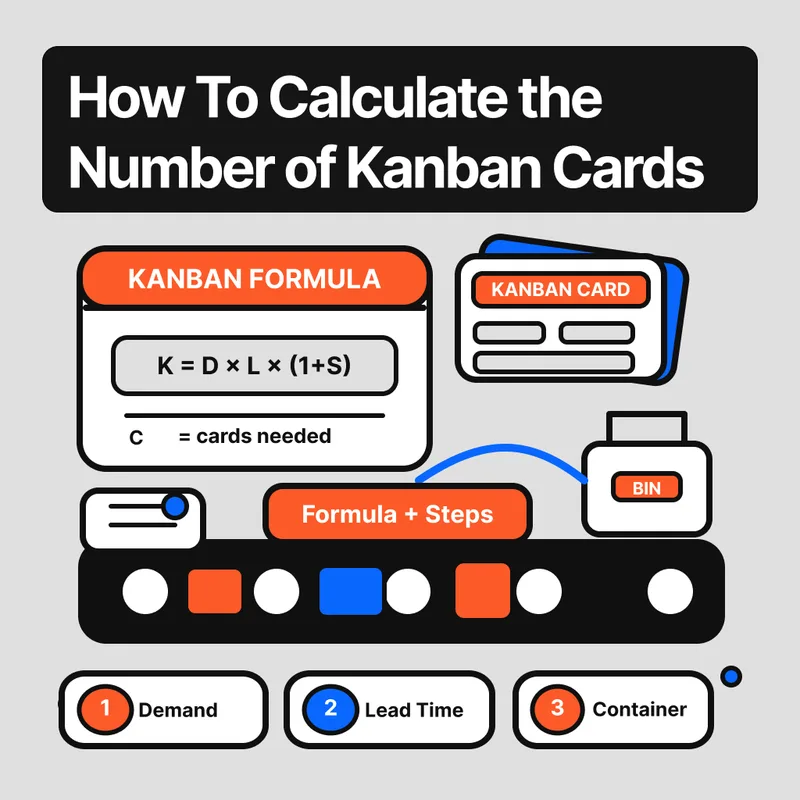
The formula N = (D × L × (1 + S)) / C gives you a defensible starting card count: enough cards circulating to keep the floor supplied while refills are in transit.
Key Takeaways
- The formula: N = (D × L × (1 + S)) / C, where D is average daily demand, L is average lead time, S is the safety factor, and C is container size.
- Always round up. Running fewer cards than the formula gives you means running short under normal conditions, not just peak ones.
- All variables must use the same time unit. If lead time is in days, demand must be in units per day.
- The most common input mistake is using the PO lead time instead of your actual average delivery time.
- Recalculate at minimum quarterly, and immediately when demand or lead times shift significantly.
What is the kanban card formula?
The kanban card formula is N = (D × L × (1 + S)) / C, where:
- N = number of kanban cards
- D = average daily demand (units consumed per day)
- L = average replenishment lead time (days from card scan to stock arriving in the bin)
- S = safety factor (a decimal cushion for variability, typically 0.10 to 0.25)
- C = container size (units per bin or container)
N tells you how many cards need to circulate in your system to keep production supplied without running short. It is a calculated starting point calibrated to current conditions, not a permanent setting.
One note for two-bin systems: in a one-card / two-bin setup, N is always 1 card per item, so you solve for bin size instead (bin size = D × L × (1 + S)).
What does each variable mean?
Each variable requires a specific type of measurement. Getting the inputs right matters more than getting the arithmetic right.
| Variable | What it represents | How to measure it |
|---|---|---|
| D | Average daily demand | 90-day rolling consumption total divided by 90 |
| L | Average replenishment lead time (days) | Average of actual delivery records over the last 12 months |
| S | Safety factor (as a decimal) | 0.10 to 0.25 based on variability |
| C | Container size (units per bin) | Set by floor ergonomics and handling |
| N | Number of kanban cards | Result — always round up |
D: average daily demand
D is units consumed per day, measured from actual floor consumption data. Use a rolling 90-day average: add up total units consumed over the past 90 days and divide by 90.
Do not use planned production rates or theoretical capacity. The formula needs what the floor actually used, not what the schedule assumed it would use.
Units consistency: All variables must use the same time unit. If L is measured in days, D must be units per day, not per week or per shift. Mixing daily demand with a weekly lead time produces a number that looks plausible but is wrong by a factor of seven.
L: replenishment lead time
L is the full cycle from the moment a card fires to the moment stock lands in the bin. This includes order processing, supplier lead time, transit, and any receiving or handling on your end.
Do not use the lead time on the purchase order. Pull the last 12 months of actual delivery records for this part and take the average time from order placement to bin arrival. The PO number is what the supplier promised; the average of real deliveries is what actually happens. You do not need to pad L for the late ones here, because the safety factor S is what covers that variability, and padding both L and S would buffer the same risk twice.
S: safety factor
S is a decimal cushion built into the formula to absorb variability. A safety factor of 0.20 means you are carrying 20 percent more stock than the base demand-during-lead-time quantity.
S rolls up two different risks into one practical number: suppliers delivering late or short (supply-side), and demand running hotter than your 90-day average (demand-side). Keeping it as one number is fine for setting a starting card count, but know what is inside it: if one of those two risks clearly dominates on a given part, size S for that risk rather than splitting the difference. A factor of zero means no cushion at all, so one late delivery or one demand spike leaves you short.
C: container size
C is the standardized quantity in each bin or container on the floor. It should be physically practical: easy to handle, easy to eyeball at a glance, and consistent across the floor for this part.
Container size determines how many cards circulate, not how much total stock you hold. Smaller bins mean more cards; larger bins mean fewer. Choose C based on floor ergonomics and handling practicality, then standardize.
Container size should normally remain stable. When demand changes, adjust card count first. Change container size only when handling, storage, or replenishment requirements change significantly, not simply because N increased.
Why does the formula work?
The formula encodes one simple idea: you need enough cards in circulation to cover everything the floor consumes while you wait for a refill.
D × L is demand during lead time. If daily demand is 60 units and the refill takes 2 days, the floor consumes 120 units before new stock arrives. The system needs enough cards to account for those 120 units being in active use. That is the base case with no cushion.
The safety factor is a multiplier rather than a fixed add-on because a percentage scales the cushion with the part's volume. A fixed addition (for example, "add 10 units of buffer") under-protects high-consumption parts and over-protects low-consumption ones. On a part you use 60 units per day, a 15 percent safety factor adds 9 units of cushion. On a part you use 600 per day, it adds 90. That is usually closer to right than a flat unit add-on. (Strictly, statistical safety stock scales with the variation in demand and lead time, not with average volume, so treat the percentage as a practical simplification, not a law.)
C divides because each card represents one container. The numerator D × L × (1 + S) tells you the total units that need to be in active circulation. Dividing by C converts that unit count into a container count. One container equals one card. If you need 138 units in circulation and each bin holds 30, you need 5 bins and therefore 5 cards.
Relationship to reorder point and safety stock. The numerator of the formula is equivalent to the reorder point: demand during lead time plus safety stock. The full formula then divides that reorder-point quantity by container size to produce a card count. Kanban and reorder-point systems use the same underlying logic. Kanban just expresses the answer as a number of cards rather than as a stock level.
| Formula | What it produces |
|---|---|
| N = (D × L × (1 + S)) / C | Number of kanban cards to circulate |
| Reorder point = (D × L) + safety stock | Stock level that triggers replenishment |
| Safety stock = S × D × L | Cushion quantity covering variability |
All three are rooted in demand during lead time. Kanban converts the reorder-point quantity into a card count by dividing by container size.
Put this card count on real cards. You can make your first kanban cards free and print them for the bins.
How do you calculate kanban cards?
The calculation runs in five steps. Each step requires real data, not estimates from memory or planning documents.
Step 1: Measure average daily demand. Pull 90 days of consumption data for the part from your inventory records. Add up total units consumed and divide by 90. That number is D.
Step 2: Establish actual lead time. Pull delivery records for the last 12 months for this part and average the total time from order placement to bin arrival. Use that average, not the number printed on the purchase order, which routinely understates real delivery time. That is L.
Step 3: Set your safety factor. Choose S based on how variable D and L are. If you have stable demand and a reliable local supplier, 0.10 to 0.15 is reasonable. If demand swings significantly or the supplier is inconsistent, use 0.20 to 0.25. When unsure, start at 0.20 and calibrate after one quarter of clean data.
Step 4: Confirm container size. Decide on a practical, standardized bin quantity. It should fit the physical storage location, be easy to move, and be easy to read at a glance. Fix this number and standardize it.
Step 5: Calculate and round up. Plug the values into the formula. Solve for N. Round up to the next whole number. Always.
Worked example
Take the M6 hex bolts feeding your assembly bench. The floor burns through 60 a day, refills land in about two days, and your supplier is reliable but not perfect.
- Part: M6 hex bolts (high-turnover consumable)
- D = 60 units per day (from the 90-day consumption log)
- L = 2 days (average from actual delivery records)
- S = 0.15 (moderate variability, reliable local supplier)
- C = 30 units per bin
N = (60 × 2 × (1 + 0.15)) / 30 N = (120 × 1.15) / 30 N = 138 / 30 N = 4.6, rounded up to 5 cards
Five cards circulate in the system. When a bin empties, its card travels to the supplier. The remaining four cards keep supply flowing while the refill is in transit.
Quick-use reference
In Excel: =ROUNDUP((D*L*(1+S))/C,0) — replace D, L, S, C with the appropriate cell references.
| Inputs | Calculation |
|---|---|
| D = 50, L = 3, S = 0.20, C = 25 | (50 × 3 × 1.20) / 25 = 7.2 → 8 cards |
| D = 100, L = 1, S = 0.10, C = 50 | (100 × 1 × 1.10) / 50 = 2.2 → 3 cards |
| D = 20, L = 5, S = 0.25, C = 10 | (20 × 5 × 1.25) / 10 = 12.5 → 13 cards |
Two-bin systems
In a two-bin kanban system there is always one card per item, so instead of solving for a card count you solve for bin size: 60 × 2 × 1.15 = 138 units per bin. When bin one empties, the card fires and bin two covers demand while the refill arrives.
What safety factor should you use?
The safety factor is the variable most manufacturers set wrong. Too low, and a single demand spike or late delivery causes a stockout. Too high, and you hold more stock than you need.
| Safety factor | When to use it |
|---|---|
| 0.10 (10%) | Stable demand, internal supplier or fixed delivery schedule, consistent consumption |
| 0.15 to 0.20 (15-20%) | Moderate demand variability, reliable external supplier with occasional delays |
| 0.25+ (25%+) | High demand variability, unreliable supplier, long or unpredictable lead times |
Start at 0.20 if you do not yet have 12 months of clean delivery and consumption data. After a year of records, you will have enough to calibrate it more precisely. A well-run system with good data typically settles at 0.10 to 0.15.
For the full methodology behind sizing the cushion, see how to calculate safety stock in a kanban system.
What are the most common mistakes?
The formula is straightforward. The inputs and edge cases are where most implementations go wrong.
Using PO lead time instead of actual. The purchase order says 3 days. The average of real deliveries is 6 days. The formula produces the wrong answer before the math starts.
Mixing time units. D is measured in units per week, L is entered in days, and the result is off by a factor of 7, producing a card count that looks reasonable but is either dramatically over or under the correct number.
Setting S too low. A 5 percent safety factor sounds reasonable until a single demand spike depletes it in an afternoon. Default to 20 percent until you have 12 months of stable, clean data.
Rounding down. 4.6 cards does not round to 4. It rounds to 5. Rounding down is planning to run short under normal conditions.
Ignoring an impractical result. A high card count is not a formula error, it is identifying a system constraint. If N is more than the floor can realistically accommodate, revisit container size, replenishment frequency, or supplier lead time. Larger bins reduce N. More frequent replenishment shortens the effective lead time, which also reduces N. Rounding down without fixing the underlying constraint just delays the stockout.
Never updating the calculation. Demand changes, suppliers change, and lead times change. A kanban quantity set 18 months ago against demand that has since grown is already wrong. Stale quantities are one of the most common causes of manufacturing stockouts.
Confusing container size with order quantity. C is the units that fit in the bin on the floor. Your supplier may sell in multiples of 100, but if your bin holds 30, C = 30. What you order and what circulates in the kanban system are two different numbers.
Applying the formula to highly variable or seasonal demand without adjustment. For parts where demand swings more than 40 percent across the year, a single static card count will be wrong for most of the year. Use separate calculations for peak and off-peak periods, or switch to a 180-day rolling average to smooth the figure.
Forcing very long lead times into a floor loop. Lead times above 30 days produce a large N that may point toward carrying pipeline stock on that part, or negotiating a shorter lead time, rather than forcing it into a standard floor kanban loop. The formula works mathematically, but the result may not be operationally practical.
When should you recalculate?
Recalculate kanban quantities at minimum once per quarter. Set it as a standing calendar task, not a reactive response to a stockout.
Trigger an immediate recalculation when any of these happen:
- Demand shifts more than 20 percent up or down over a rolling 30-day period
- A supplier changes or shows a significant shift in delivery performance
- Your production schedule changes in a way that alters floor consumption
- A new product launch or customer order changes how much of this part the floor uses
The formula produces a number based on current conditions. When conditions change, the number changes. The calculation is not a one-time setup task.
This is the step most shops quietly skip, because pulling 90 days of consumption and a year of delivery records by hand, every quarter, for every part, is nobody's favorite afternoon. That is where running your cards on a digital backend earns its keep: the consumption and delivery history you need for D and L is captured automatically as cards move through the loop, so a quarterly recalculation reads from real records instead of a manual re-count. Cards on the floor, the math kept honest in the background. If that is the version of kanban you want to run, see how Arda does it.
FAQ
What is the formula for the number of kanban cards? N = (D × L × (1 + S)) / C, where D is average daily demand, L is average replenishment lead time in days, S is the safety factor as a decimal, and C is the container size in units. Always round N up to the next whole number.
What happens to kanban card count if lead time increases? Card count increases proportionally. If lead time doubles, demand during lead time doubles, and you need roughly twice as many cards to keep supply flowing. A PO lead time shorter than actual delivery performance produces a card count that is too low.
What happens if I use too few cards? The system runs short before the refill arrives. Too few cards means the pipeline cannot cover demand during lead time, so bins run empty even when replenishment is working correctly. The only fix is to add the missing cards. Fewer cards than the formula specifies is not a lean economy, it is a planned stockout.
Can I use this formula for a two-bin system? Yes, but the interpretation changes. In a one-card / two-bin system there is always one card per item, so you use the formula to calculate bin size instead: bin size = D × L × (1 + S). The result tells you how many units each bin should hold.
Can I calculate kanban cards in Excel? Yes. Enter your values in separate cells and use =ROUNDUP((D*L*(1+S))/C,0) where D, L, S, and C are replaced with cell references. The ROUNDUP function ensures the result is always rounded up, not to the nearest whole number.
How do kanban cards relate to safety stock and reorder point? The numerator of the formula, D × L × (1 + S), is equivalent to the reorder point: demand during lead time plus safety stock. Dividing by C converts that stock quantity into a card count. Kanban and reorder-point inventory systems use the same underlying logic; kanban expresses the answer as a number of cards rather than as a stock level.
What if demand is very low or intermittent? If demand is intermittent or extremely low, the formula may produce a result below one card. In these cases, set a minimum of one card and round up. If a part is ordered rarely, once a month or less, consider managing it outside the kanban system using periodic review or min-max controls instead.
Should I round up or round down the result? Always round up. A result of 4.2 means 5 cards, not 4. Rounding down means you have deliberately planned for fewer cards than the formula says you need, which means running short under normal conditions.
How do I know if my kanban quantities are wrong? Three signs: stockouts occur despite cards being in circulation, bins run empty before the refill arrives, or cards pile up with no active replenishment in transit. Any of these indicates that D, L, or S in the original calculation no longer reflects current conditions.
Make the first replenishment loop visible.
Generate free Kanban cards for the parts that most often stop production.
Make Free Kanban CardsRelated reading

OEE for Manufacturers: How to Calculate and Improve Overall Equipment Effectiveness
Learn how to calculate OEE in manufacturing with the exact formula, a worked example, Six Big Losses breakdown, and practical steps to improve your score.
Jul 13, 2026Read article
Inventory Turnover Ratio Formula: How Manufacturers Measure Inventory Efficiency
Learn the inventory turnover ratio formula, how to calculate it with a real manufacturing example, and what a good ratio looks like for your shop floor.
Jul 8, 2026Read article
Buffer Stock vs. Safety Stock: Understanding the Key Differences
Buffer stock manages internal flow variations while safety stock guards against supply disruptions. Learn the formulas, when to use each, and how they work in Kanban systems.
Mar 20, 2026Read article